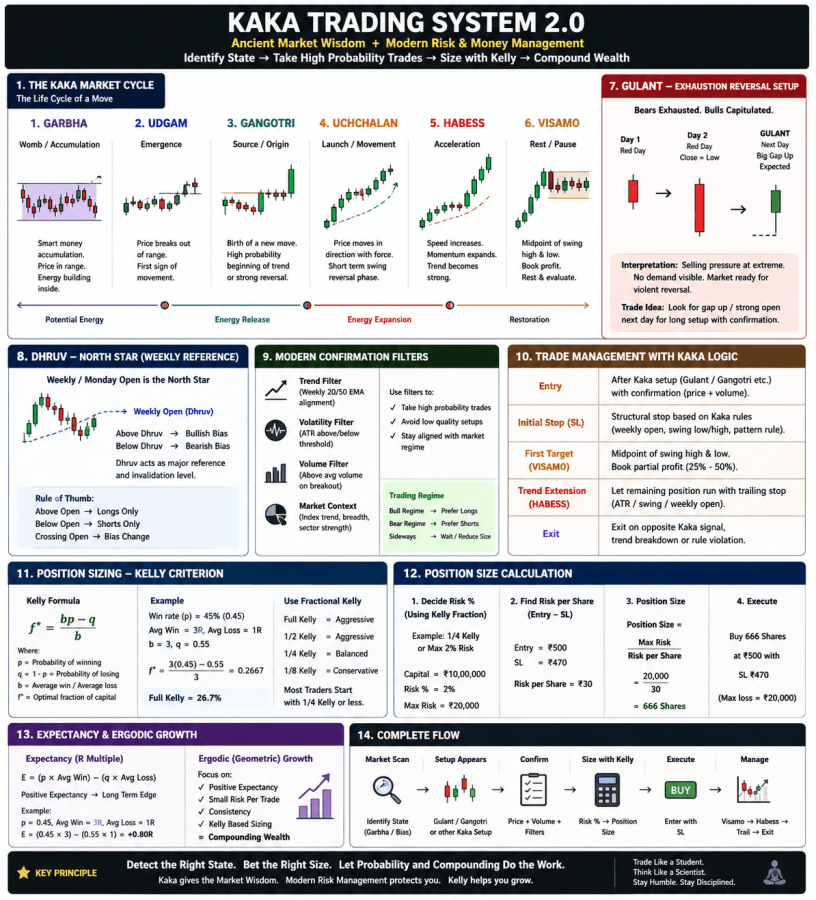
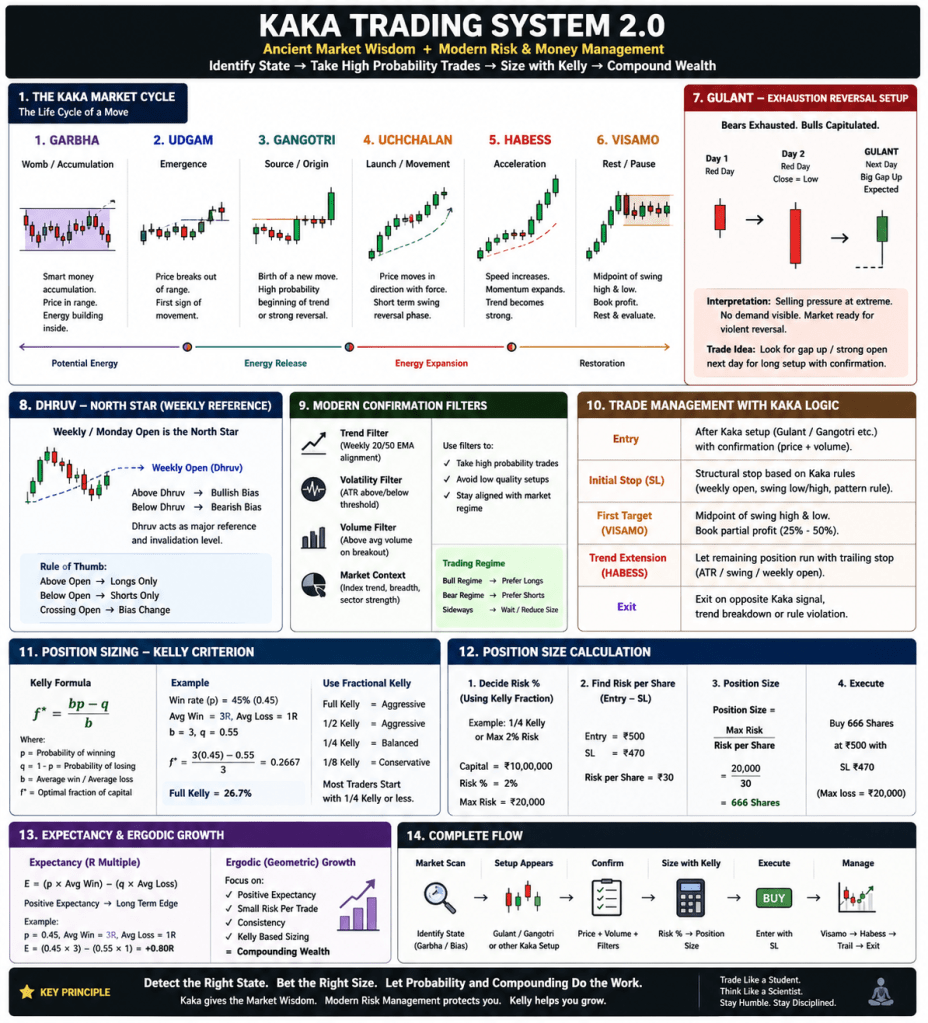
An exploration of an unconventional Indian trading framework built around price action, market structure and a distinctive set of original formations.
There are thousands of trading systems built around moving averages, oscillators, indicators, candlestick formations and mathematical models.
But occasionally, a completely different kind of trading system emerges.
The KAKA Trading System is one such example.
It belongs to an older Indian trading tradition in which markets were studied directly through price behaviour, charts were drawn by hand, and recurring market situations were given distinctive Indian names rather than being described through the terminology now common in technical analysis.
What makes the system interesting is not simply its individual formations. It is the way those formations function as keys to market behaviour.
The basic questions are simple:
- Where is the market going?
- When has the market given a sufficiently strong signal to participate?
- When should the trader remain in the position rather than reacting to every short-term fluctuation?
The Idea of a “Key”
At the heart of the KAKA system is the idea of a चाबी — Chaabi, or key.
A formation is not merely a visual pattern. It is a potential key that unlocks a trading decision.
Once a valid key appears, the trader does not necessarily exit simply because the market pauses, consolidates or produces another ordinary candle. The objective is to follow the move toward its defined target.
Instead of constantly asking whether the latest candle has changed the trade, the system asks whether a new key has appeared.
1. Gangotri — गंगोत्री
Gangotri is a bottom-facing reversal formation. The market should already be in a bearish trend, producing lower lows and lower highs.
A swing bottom is broken. The next day opens at or below the previous low. It may make another low. The important reversal occurs when the day subsequently closes above the relevant reference level — the higher of the previous day’s open and close. The day itself must be bullish.
The traditional target associated with Gangotri is approximately 25% above the low. For example: low = ₹100; target = ₹125. The stop is associated with the formation’s low.
2. Pachhadat — पछड़ात
Pachhadat is the opposite or inverted form of Gangotri. Where Gangotri represents a bullish reversal from a declining market, Pachhadat represents the corresponding bearish structure.
Gangotri → downward move reverses upward
Pachhadat → upward move reverses downward
The original name is important. It would be easy to replace it with a familiar modern description such as “bearish reversal” or “inverse Gangotri,” but that would remove part of what makes the KAKA system distinctive.
3. Aavesh — आवेश
Aavesh is different from a simple reversal formation. It functions as a confirmation or addition key.
A previous setup has already created the trading opportunity. Aavesh provides additional evidence that the move is continuing. The formation uses the relationship between the current day and the relevant previous-week reference levels.
Its practical significance is important. An existing position can gain additional confirmation, and the trader may add to the position rather than treating Aavesh as an entirely new trade. It can also permit the stop to be moved upward to a newer structural low.
4. Ucchalan — उच्चालन
Ucchalan means crossing. It is one of the most interesting concepts in the system because it exists at multiple scales: Daily Ucchalan, Weekly Ucchalan, Monthly Ucchalan and Swing Ucchalan.
Daily Ucchalan can indicate continuation of an existing upward move after a correction.
Weekly Ucchalan can indicate a possible change in the broader trend. A bearish weekly environment produces a new low, followed by a recovery that crosses the relevant previous-week reference level. The new low provides the structural stop.
Monthly Ucchalan extends the same logic to an even larger timeframe. A declining monthly structure produces a new low, followed by a recovery that crosses the relevant previous month’s reference. The new monthly low becomes the important risk reference.
5. Swing Ucchalan — स्विंग उच्चालन
Swing Ucchalan is based directly on swing structure. A previous swing low exists. The market subsequently breaks that swing low. Instead of continuing downward, however, it closes back above the previous swing-low reference.
The expected objective is the previous swing high from which the decline began.
In simplified form: old swing high → decline → new swing low → recovery → return toward old swing high.
6. Half Gangotri — हाफ गंगोत्री
Half Gangotri is a simplified version of the Gangotri concept. The market opens below the previous low and subsequently closes above the relevant previous reference. The day must be bullish.
The original name matters because it preserves the relationship between the formations rather than reducing everything to a generic “bullish reversal.”
7. Kick — किक
Kick is another simplified reversal key closely related to Gangotri. The market opens below the previous low and subsequently closes above the relevant previous reference. The day must be bullish.
8. Kicker — किकर
Kicker represents a strong reversal-type movement involving the previous day’s high and a strong opening relationship. The new candle opens above the relevant previous level and continues higher.
The strength of the movement is itself important. Kicker is based primarily on what price has actually done at an important reference level.
9. Buland — बुलंद
Buland represents another rapid reversal idea. The market is in a strong declining trend and new lows continue to appear. Then a candle closes at or near the low, creating the conditions for a potential sharp reversal.
Its attraction is speed. A gap-down occurrence should not be treated as the valid setup, and if the relevant low is subsequently broken, the position should be abandoned.
10. Garbh — गर्भ
Garbh is unusual because it is associated specifically with an IPO listing day. The listing day’s behaviour itself becomes the important observation.
A bullish listing produces one interpretation and a bearish listing the opposite. There is no simple universal fixed-percentage target attached to Garbh. Instead, the listing-day behaviour is treated as an important indication of the stock’s future character.
11. Dhruv — ध्रुव
Dhruv may be one of the simplest ideas in the entire system. The opening price of the first trading day of the week becomes Dhruv.
Price above Dhruv suggests a bullish environment. Price below Dhruv suggests a bearish environment. The reference level therefore provides a directional filter for the week’s trading.
12. Vishamo — विशामो
Vishamo introduces another important idea: the distance between two important swing levels can itself become a target.
Suppose a stock creates a swing high of ₹324 and a swing low of ₹283. The difference is ₹41. That measured distance can then be projected from the relevant breakout point to establish a potential target.
Vishamo therefore transforms market structure into a measurable objective.
13. Purn Viram — पूर्ण विराम
Purn Viram represents a final-stop / final-reversal concept. The market continues declining, a significant swing bottom is broken, and a new lowest low appears. The market then opens above the relevant close associated with that low and subsequently recovers.
The formation suggests that the decline may have reached its final stage. The name itself is revealing: Purn Viram means a full stop. The formation represents the possibility that the bearish phase has reached its concluding point and a bullish phase may begin.
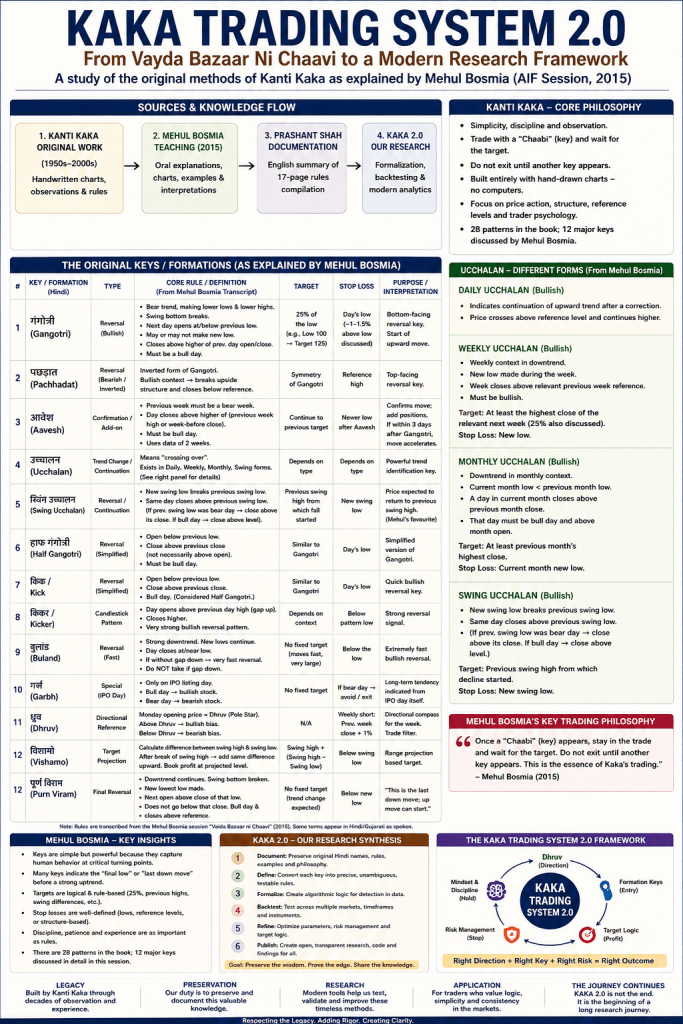
The Deeper Structure of the KAKA System
When these formations are viewed together, something becomes apparent. The KAKA system is not simply a collection of unrelated candlestick patterns.
- Direction: Dhruv
- Reversal: Gangotri, Pachhadat, Half Gangotri, Kick / Kicker, Buland and Purn Viram
- Trend transition: Ucchalan and Swing Ucchalan
- Confirmation: Aavesh
- Measurement: Vishamo
- Special situation: Garbh
This is where the system becomes considerably more interesting than a simple list of patterns.
KAKA 2.0: From Trading Wisdom to a Testable System
The next stage is not to replace these ideas with modern indicators. It is to formalize them without destroying their original identity.
- What exactly constitutes a swing?
- What qualifies as a valid break?
- Which price reference takes priority when several levels exist?
- How should gaps be treated?
- How long does a key remain valid?
- What happens when two keys appear close together?
- What happens when a new key contradicts an existing position?
- Does the 25% target remain effective across different stocks and timeframes?
- Does Dhruv improve directional selection statistically?
- Does Aavesh improve the probability of reaching the original target?
- Does Vishamo outperform conventional fixed-percentage targets?
- Which formations remain robust across different markets?
These are research questions, not assumptions.
The original KAKA system should remain intact. KAKA 2.0 can then test it.
Why This Indian Trading System Deserves Another Look
Modern trading has become increasingly sophisticated. Charts are covered with indicators. Algorithms scan thousands of securities. Machine-learning models search for patterns that humans cannot easily see.
Yet the underlying market still produces only a limited number of fundamental things: price, time, highs, lows, openings, closes, breaks and reversals.
The KAKA system works remarkably close to those fundamentals.
Its language is different. Its names are different. Its philosophy developed in a very different technological environment. But that may be precisely why it deserves investigation.
It represents an example of Indian market knowledge developed outside the mainstream technical-analysis tradition.
Whether every historical rule remains effective today is an empirical question. But the system is valuable enough to preserve, formalize and test.
The objective of KAKA 2.0 is therefore not to modernize the system by erasing its original terminology.
Preserve the original names.
Preserve the original rules.
Understand the underlying logic.
Test the rules systematically.
And only then determine which parts of this largely forgotten trading framework still contain an edge.
A Forgotten System, A Modern Question
A trading system does not have to begin with a computer.
Sometimes it begins with someone watching the market carefully for years.
A line is drawn. A relationship is noticed. A reversal repeats. A name is given to it.
Eventually, a collection of observations becomes a system.
The interesting question for KAKA 2.0 is not whether an old trading legend should automatically be believed.
It is whether the observations hidden inside that system can survive modern statistical testing.
That is the experiment worth conducting.
Attribution: The trading methods and original terminology discussed in this article are attributed to Mr. Kanti Parekh, fondly known as Kanti Kaka, and the trading knowledge associated with his work Vayda Bazaar Ni Chaavi.
Disclaimer: This article is for educational and research purposes only. It is not investment advice, a recommendation to buy or sell any security, or a guarantee of trading performance. Trading and investing involve substantial risk of financial loss. Historical patterns and trading rules may fail under future market conditions. Readers should conduct their own research and, where appropriate, consult a qualified financial professional before making investment decisions. Never risk money you cannot afford to lose.
 Future Trends | Life Hacks | Love Lessons